The Basics Of Reading A Topographic Map
Being able to read a topographic map is an essential skill for anyone going into the backcountry. This guide will teach you all of the basics you need to know!
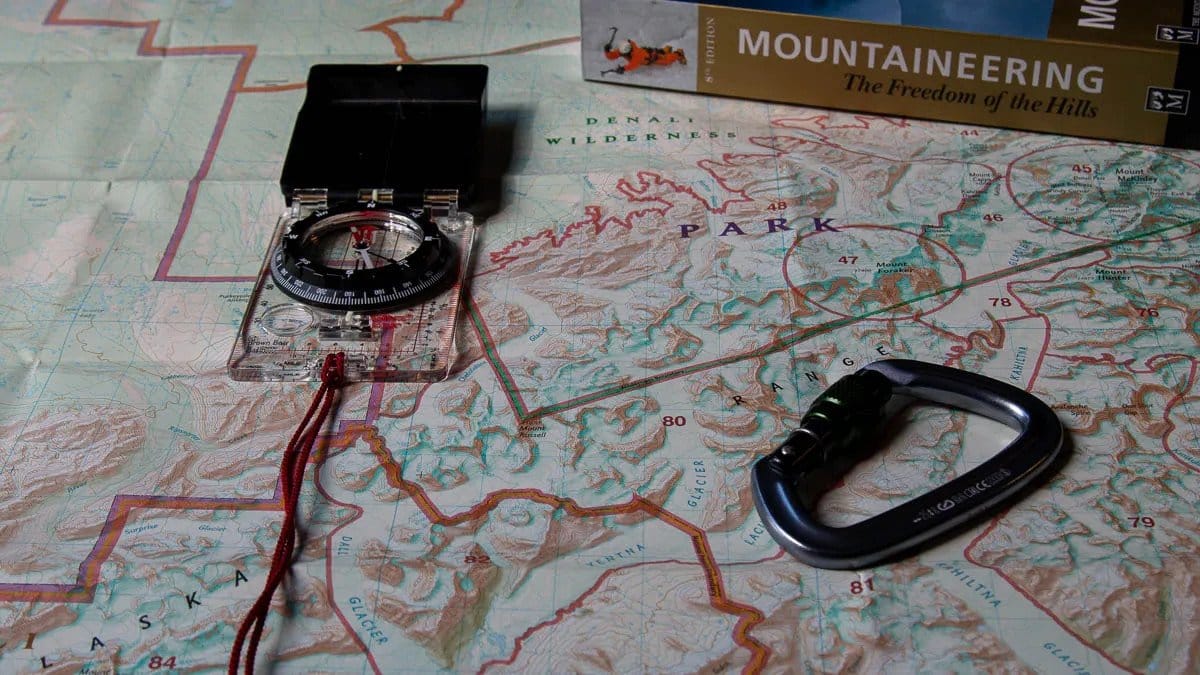
In this tutorial, I will teach you the basics of reading and understanding a topographic map. This skill is critically important for anyone who plans on venturing out into the backcountry. Not only is it essential that you always carry a paper, hard-copy map of where you will be going, but it’s also vital that you know how to read it!
This article will teach you the basics, but reading and understanding topographic maps is a skill. Like any skill, it takes practice to master it fully. Simply reading a guide or watching a video will not be enough to fully understand it, so make sure you practice!
What You’ll Learn
The primary learning objectives for this section are:
- Review the basics of what a map is.
- Understand the basics of how cartographers divide up the Earth.
- Understand some of the various types of maps available.
- Learn basic map concepts, like map scale.
- Understand the basic types and notations of USGS maps.
- Learn the basics of reading a topographic map.
- Learn how to identify various geological features on a topographic map.
We have much to cover, so let’s not waste any time and dive right in!
Map basics
Before we can really read a topographic map, we must first answer the most basic question: What exactly is a map?
The simplest explanation is that a map is a symbolic representation of a physical place. They provide a convenient, shorthand notation that allows us to convey a vast amount of information about an area in a way that’s easy to understand and carry with us.
Maps provide a lot of useful information. For example, a roadmap allows you to see the various roads that run through an area and determine a driving route. The maps that we are going to be focusing on here, topographic maps, provide a plethora of information for the wilderness traveler. Here are just a few of the things that we can see on a topographic map:
- Various topographic features
- Elevation and terrain information
- Information on vegetation
These items will be discussed in more detail later in this guide.
Map terms and concepts
To fully understand how to read and understand a map, we must first examine some of the terminology and concepts used by the cartographers who make them.
How cartographers divide up the Earth
NOTE: This section can technically be viewed as optional when it comes to understanding how to read a topographic map. That said, I think it’s an important concept to understand, especially with the prevalence of GPS units. This information will also serve you well in future navigation skills posts on this site!
If you weren’t already aware, the Earth is a pretty huge place (approximately 197 million square miles)! To make life easier, cartographers have developed a system to divide the planet into various regions.
To start with, the distance around the Earth is divided into 360 different units, called degrees (denoted by the ° symbol). A measurement along the east or west axis is referred to as longitude, and a measurement along the north or south axis is referred to as latitude.
Longitude is measured from 0° to 180°, both east and west, starting at a spot referred to as the prime meridian, which is just an imaginary line that runs through the Royal Observatory in Greenwich, near London, England.
Latitude is measured from 0° to 90°, north and south, starting from a spot called the equator, which is just an imaginary line that runs through the center of the planet, dividing it into two separate hemispheres.
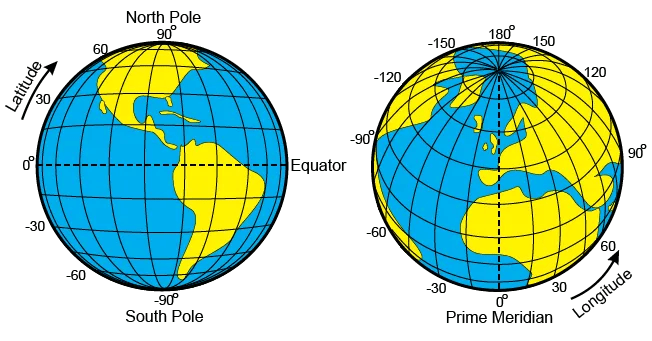
Each degree is further divided into 60 units called minutes (denoted by the ‘ symbol), and each minute is divided into 60 units called seconds (denoted by the ” symbol). These divisions allow us to precisely represent a spot on Earth as a coordinate.
For example, let’s consider Chimney Rock in the Red River Gorge. This geological feature is located at a latitude of 37 degrees 49 minutes 21.72 seconds North and a longitude of 83 degrees 37 minutes and 22.08 seconds West. Using the notation we discussed above, we can more compactly express the location of Chimney Rock as:
37° 49′ 21.72″ N
83° 37′ 22.08″ W
Having a system like this allows us to easily represent any given point on the Earth and also gives us a way to communicate where a particular location is on the planet.
Other notations for representing latitude and longitude exist, one being decimal degrees, but we’ll save those for a future lesson. Another commonly used positioning system is Universal Transverse Mercator (UTM), but again, we’ll save that for later.
This is about as much detail as I will provide on this topic. If there is interest, I can provide future navigation skills posts that cover this kind of information in far more detail.
The scale of a map
For obvious reasons, we can’t create a map that’s actually the size of the area we want to represent (imagine trying to carry that thing around!). To compensate for this, we scale down the map to a smaller size.
The scale of a map is the ratio of how a measurement on the map correlates to a measurement in the real world. One of the most basic and common ways this is done is by having a particular measurement on the map correspond to a particular measurement on the ground (for example, 1 inch on the map equals 1 mile on the ground). Another way is to give a mathematical ratio of how a measurement on a map corresponds to a measurement on the ground.
For example, one of the most common ratios in the United States is 1:24,000. This means that one unit of measurement on the map will equal 24,000 units of measurement in the real world. For example, 1 inch on the map would be equivalent to 24,000 inches on the ground.
The map’s scale will be represented graphically, typically at the bottom of the map.

Map Datum
The concept of a map's datum can be confusing when you first encounter it. Many introductions to reading topographic maps tend to ignore this point, but it is important if you intend to do any sort of precise navigation with your map. As such, I feel it’s pertinent to introduce the concept here.
What is a Datum?
The process of making a map involves surveying the land. This can essentially be thought of as measuring where various geographic features are on Earth. This isn’t as simple as it may initially sound, however. The Earth is an ellipsoidal object with a varied, three-dimensional surface. As such, surveyors need to use a whole host of calculations to best approximate the positions of these features.
Before the advent of satellites, these measurements and approximations were done by hand. Surveys would measure from “known” positions and base the positions of all other geographic features relative to this known position. On the small scale, this can have decent results, but the further out you get, the larger the margin of error becomes.
The most common map datum you’re likely to come across from this era of doing things (at least in the United States) is called the North American Datum of 1927 (NAD27). This datum started from a spot in Meades Ranch, Kansas (chosen because it’s roughly the center of the continental U.S.) and spread out across the United States. As mentioned earlier, the likelihood of encountering errors with this method only increased as you moved further from this starting point.
This brings us to the more modern era, when we have satellites at our disposal. These satellites allow us to map the surface of the Earth with a level of detail unlike ever before. Today, the most common projections from this era are the North American Datum of 1983 (NAD83) and the World Geodetic System of 1984 (WGS84). WGS84 is nearly identical to NAD83 in every practical sense and is the default projection used by most GPS devices.
Where to Find the Datum of Your Map
As with much of this article, I will primarily focus on the USGS maps. On these maps, you can find the datum the map uses in the lower left-hand corner.
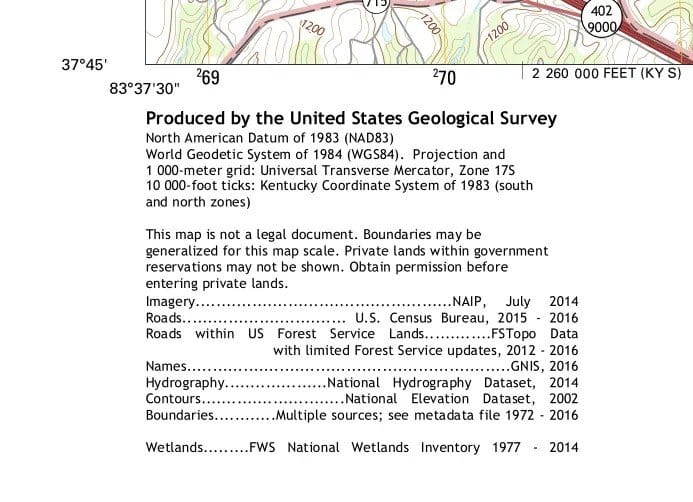
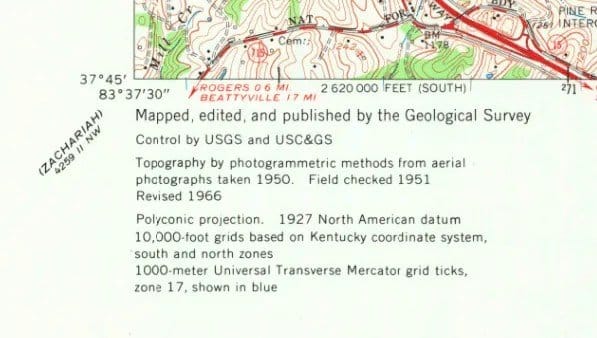
Left: A newer style USGS map that uses the NAD83 datum. Right: An older style USGS map that uses the NAD27 datum.
Why does this matter?
At this point, it may seem reasonable to ask why you’d ever need to worry about this. In terms of just understanding how to read a topo map, you don’t. The problem, however, can come into play if you try to pair your map with a GPS.
As mentioned earlier, most GPS devices use the newer WGS84 projection. It’s not uncommon, however, to come across maps that still use the NAD23 datum. In fact, a large number of USGS maps prior to 2006 still used NAD27 as their projection! If the datum that your GPS is set to use doesn’t match the datum of the paper map you’re using, you will see a huge difference in the positions between the two, potentially even hundreds of meters!
This becomes extremely important if you move on to more advanced wilderness navigation topics.
Types of maps
In addition to these basic terms and concepts, various types of maps are available to the backcountry traveler. We will briefly examine some of these.
Relief Maps
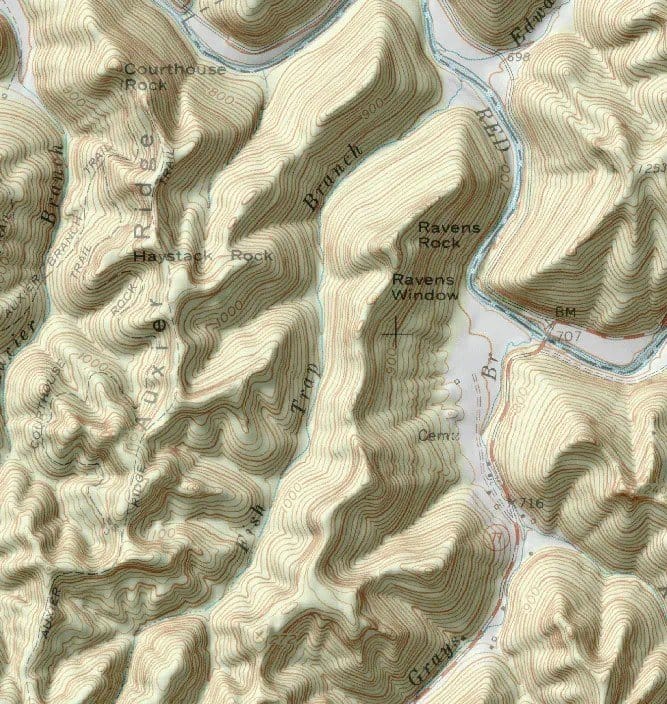
A relief map attempts to represent an area’s terrain in three dimensions by using various shading techniques. This can help visualize how the terrain is shaped and can thus prove useful when planning a route.
It’s also worth noting that a relief map can be combined with a topo map, like in the example below.
Guidebook Maps
I tend to lump any of the maps that you might find in a guidebook into this one category. In reality, maps found in books can vary significantly in quality. Some provide ultra-detailed topographic maps, whereas others are barely passable sketches. Regardless of which class they fall into, guidebook maps should only be used to aid in planning a trip. One should never base a trip solely on a guidebook map. That’s what a good topographic map is for!
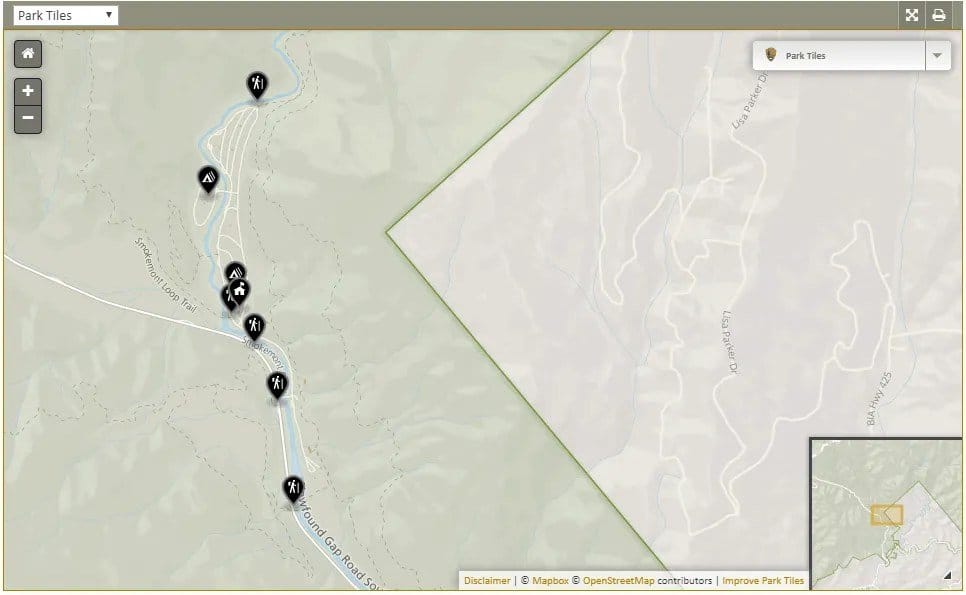
Land Management and Recreation Maps
The U.S. Forest Service or other government agencies usually publish these maps. They tend to be updated frequently, so they are great for getting current information on roads, trails, and ranger stations. These maps typically aren’t detailed enough to do any serious navigation with, but they can be great for some initial trip planning.
Topographic Maps
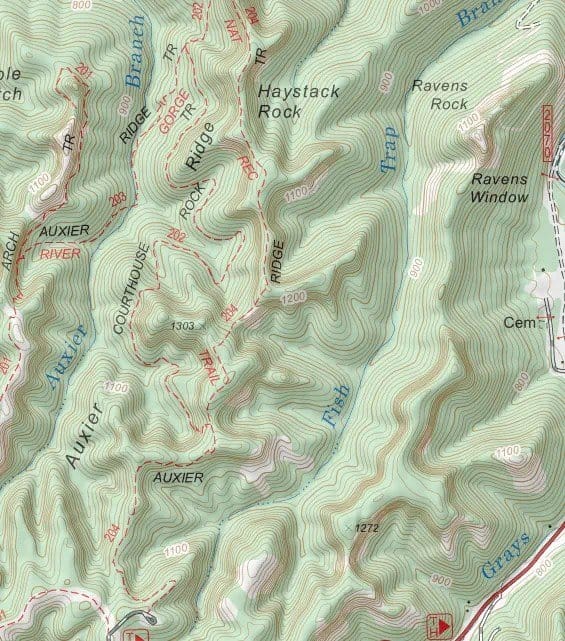
These are the most versatile maps available to the backcountry traveler and are the type that I will focus on for this guide. A topographic map depicts the topology, or the shape, of the Earth’s surface. It does this by using contour lines to represent the terrain elevations above and below sea level (don’t worry; this will make more sense later on).
These maps are essential to any off-trail travel and should be carried on EVERY wilderness trip. In addition, it is critical that you and everyone else in your party know how to properly use a topographic map. This skill can (and has) saved lives.
Using maps from the USGS
Here in the United States, we have access to an amazing resource of maps produced by the United States Geological Survey (USGS). These maps are freely available and are some of the best topographic maps you can get in the U.S. Because these are some of the best and most commonly used topographic maps we have available, I want to take some time to familiarize you with the specifics of the USGS maps.
The most commonly used USGS maps for wilderness travel are referred to as the 7.5-minute series. A map in this series covers an area that is 7.5 minutes (or 1/8th of a degree) of latitude by 7.5 minutes of longitude in size.
It’s also worth noting that you may still come across the 15-minute series of maps from the USGS. These older maps cover an area that is 15 minutes (1/4 of a degree) of latitude by 15 minutes of longitude in size. The 15-minute series doesn’t cover as much detail as the 7.5-minute series. It takes four 7.5-minute series maps to cover the same area covered by a single 15-minute series map.
As I already mentioned, the 7.5-minute series maps are the standard go-to maps for the contiguous United States (and Hawaii). They are the most commonly used maps for wilderness navigation in the United States outside Alaska. The 7.5-minute maps have the following properties:
- The scale is 1:24,000. This equals 2.5 inches, roughly equaling 1 mile (or 4 centimeters to one kilometer).
- Each map covers an area of about 6 by 9 miles (or 9 by 14 kilometers).
- The UTM squares are 1 kilometer per side
Notice that I mentioned that the 7.5-minute scale maps are the standard for all of the U.S. outside Alaska. Because Alaska is so insanely huge, the 15-minute series maps are the standard there. These maps have the following properties:
- The scale is 1:63,360. This equates to 1 inch equalling 1 mile (or 1.6 centimeters to 1 kilometer).
- Because of the way the longitude lines converge at the north pole, the north-south extent of each Alaska map is 15 minutes, but the east-west extent is greater than 15 minutes.
- Each map covers an area of about 12 by 16 miles (or 19 by 26 kilometers) in the east-west dimension and 18 miles (28 kilometers) in the north-south direction.
Each USGS map is referred to as a quadrangle (or quad for short) and is bounded on the north and south by latitude lines that differ by an amount equal to the map series (7 minutes or 15 minutes) and on the east and west by longitude lines that differ by the same amount (barring Alaska, of course). Each quadrangle is named after a prominent topographic or man-made feature in the area.
How to read a topographic map
With all those map basics out of the way, we can finally start learning how to read a topographic map.
For any map, you have to learn to read and understand the language of the map. In some cases, this language is expressed using words, but more often it’s done through the use of symbols.
To read and understand a topographic map, you must understand the language of the colors used and the contour lines.
The colors on a USGS topographic map
Regarding the USGS maps, various colors have specific, defined meanings. Let’s break these colors down to determine what they mean:
- Red: Used to denote major roads and survey information.
- Blue: Represents bodies of water (rivers, lakes, springs, and other water features).
- Black: Used to denote minor roads, trails, railroads, benchmarks, buildings, UTM coordinates and lines, latitude and longitude lines, and various other features that are not a part of the natural environment.
- Green: Used to denote the amount of vegetation in an area. A solid green is used to denote a forested area, whereas a mottled green indicates an area that has more scrub-like vegetation. It’s important to note that a lack of green does not indicate a lack of vegetation. This indicates that the amount of vegetation is too sparse to be indicated on the map.
- White: This is the color of the paper on which the map is printed. Depending on the terrain, white can have various meanings.
- White with Brown Contour Lines: This represents an area without substantial forest, such as a high alpine area, a meadow, or even an avalanche gully.
- White with Blue Contour Lines: These lines represent either a glacier or a permanent snowfield. The contour lines for these areas are solid blue, with the edges indicated by dashed blue lines.
- Brown: Represents contour lines and elevations. This applies to everywhere except glaciers and permanent snowfields (as mentioned above).
- Purple: This indicates a partial revision of an existing map.
Contour lines
What really gives a topographic map its power are the contour lines. A contour line represents a constant elevation as it follows the shape of the terrain.
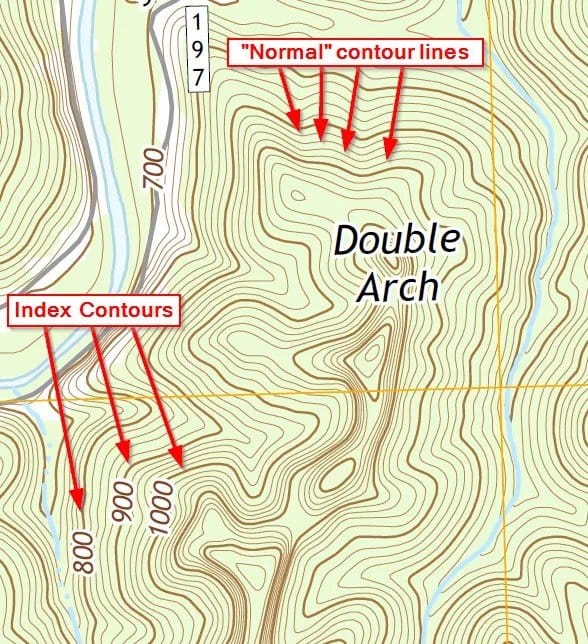
The contour interval is the distance in elevation between two adjacent contour lines. This interval should be clearly stated at the bottom of the map. Every fifth contour line is called an index contour. Index contours are typically bolder than a normal contour line and have the elevation printed on them.

Is the concept of a contour line still a little shaky? No problem, let’s take a look at some examples.
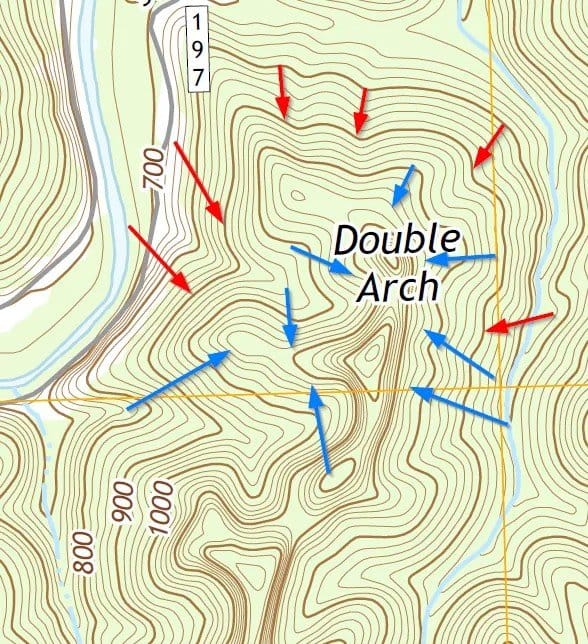
Consider Double Arch in the Red River Gorge National Geological Area, Kentucky (note: this can be found on the Slade quadrangle):
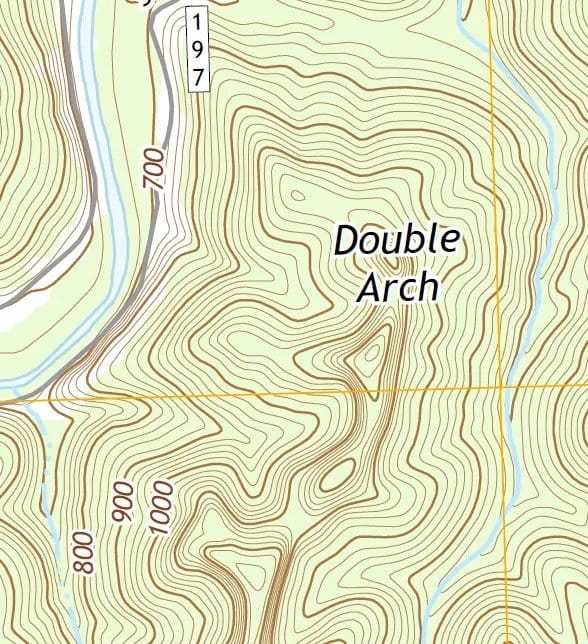
Notice all the brown lines on this map. These are the contour lines, and they follow the shape of the landscape. Every point along a given contour line is at the same elevation.
Also, notice that some of the contour lines are bold and have a number listed. These are the index contours. Three examples of index contours on this map are the ones at 800 feet, 900 feet, and 1,000 feet.
Determining the elevation of a contour line
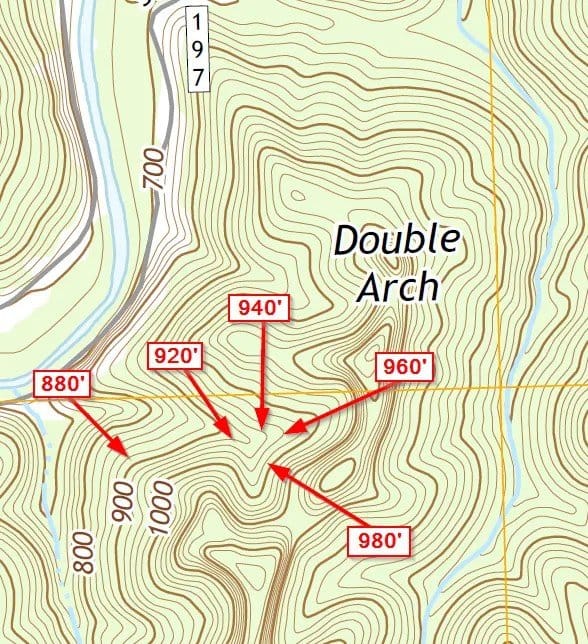
As we saw earlier, the contour interval on this particular map is 20 feet. This means the distance between two adjacent contour lines will be 20 feet in elevation. Using the known elevations from our index contours, we can determine the elevation of any given contour line on the map.
Uphill vs. Downhill
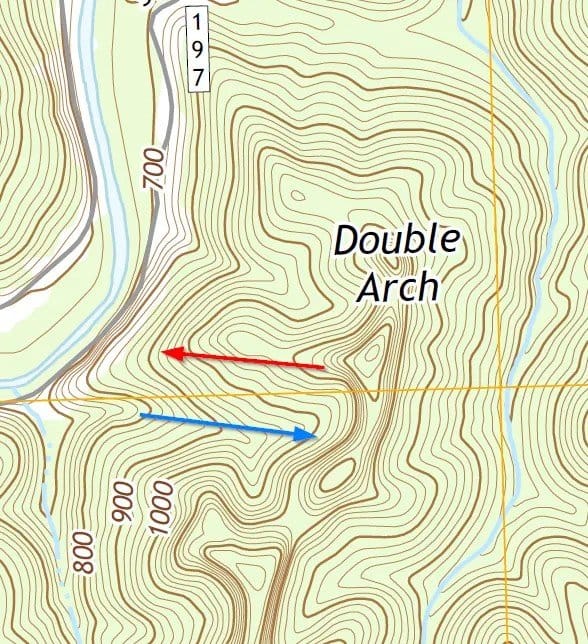
At this point, we now know enough to answer one of the most fundamental questions that a wilderness explorer might have when planning a route: Will I be traveling uphill or downhill? The concept is quite easy. If our route crosses an area with contour lines of increasing elevation, we will be traveling uphill. Conversely, if the route crosses an area with contour lines of decreasing elevation, we will be traveling downhill.
Determining how steep a section on the map is
At this point, we have a basic understanding of a contour line, how to determine the elevation that any given contour line represents, and even how to determine if a route will take us uphill or downhill. We are certainly well on our way to becoming full-fledged wilderness navigators!
The next important thing we need to know is how steep a particular region is. Is the elevation we’re looking at a flat meadow, a steep hill, or a sheer cliff? This is obviously information that we need to know!
Once again, the concept of how to determine this is remarkably simple! Recall that we know that the distance between two adjacent contour lines is constant. In the case of the map I’ve been using as an example, the distance is 20 feet. This logically means that the closer two adjacent contour lines are together, the steeper the slope. In contrast, the farther apart two contour lines are, the more gentle the slope. Let’s consider a few examples to illustrate this better.
A Relatively Flat Area with Very Little Elevation Change
Let’s take a look at the map of an area that is extremely flat and that has very little elevation change. In particular, let’s look at a section of the Dolly Sods Wilderness in West Virginia.
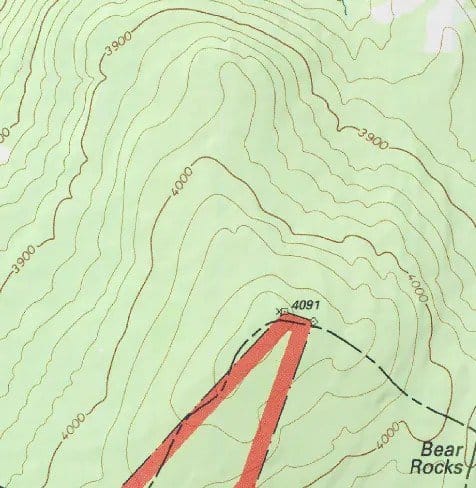
Notice the considerable distance between the contour lines here. This indicates to us that this is a very flat, almost meadow-like landscape. There is very little elevation change, and travel across this terrain should be relatively easy (in terms of elevation differences, that is).
A steep hill
Let’s return to our example region in Red River Gorge and consider an area with much steeper terrain.
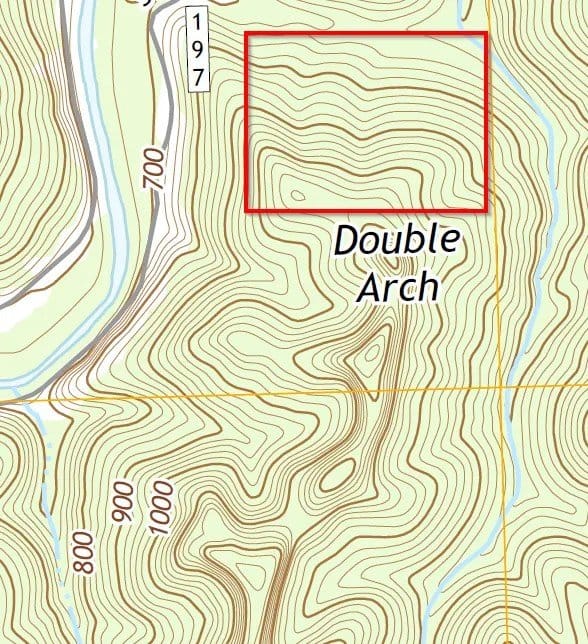
This is an example of what a much steeper hill would be. Notice that the hill gets much steeper towards the top than it is at the bottom. This hill would be steep but still walkable.
A sheer cliff
For a final example of determining the steepness of the terrain, let’s examine a sheer cliff.
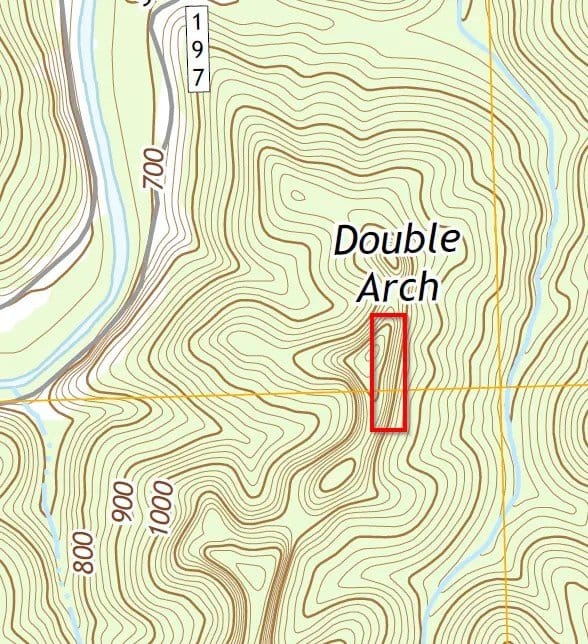
Notice how close together the contour lines are here. This indicates to us that we are dealing with a sheer cliff face. Barring the use of specialized equipment, like ropes and harnesses, this area will be completely impassable.
Identifying geological features
At this point, you have all the essential tools you need to start reading and interpreting topographic maps. The next step is to build on this base knowledge to learn how we can actually identify geological features on a map.
The contour lines tell us more than elevation; they also tell us about the shape of the landscape. Using these two-dimensional lines, we can get a three-dimensional picture of the landscape and identify what an area actually looks like. With some practice, it’s easy to point out features like mountains, ridges, drainages, and passes.
The best way to learn to identify these is to look at some examples.
Peaks and Summits
Peaks and summits are represented on a topographic map by concentric patterns of contour lines. The summit will be the innermost ring in the pattern. It’s also common practice to mark summits with an x, an elevation marker, or a triangle symbol.
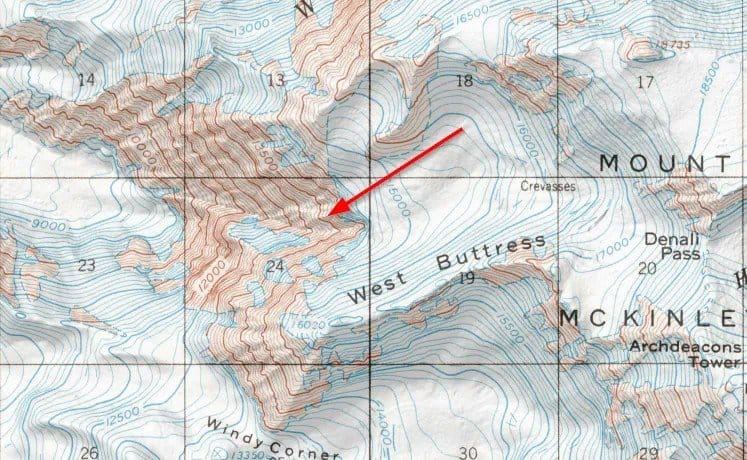
The Mt. Denali region of Denali National Park, Alaska, provides a more dramatic example of a summit.
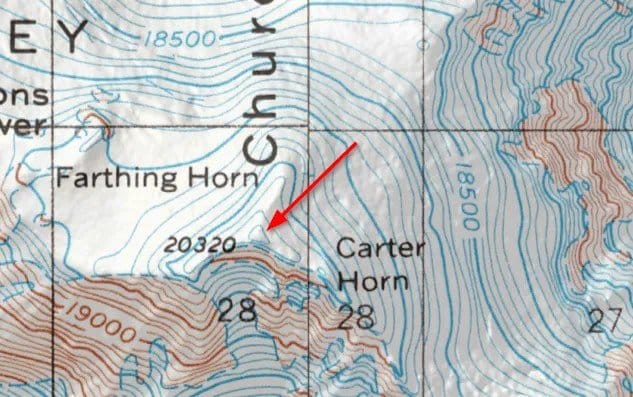
Also, notice the white areas with blue contour lines in the Denali example. Remember what that denotes from earlier?
Ridges
The contour lines of ridges form a U or a V shape. That is to say that you can notice the elevation will drop off on either side of the ridge. Contour lines in the shape of a U will indicate a more gentle ridgeline, whereas a V shape indicates a much steeper ridge.
The Double Arch area we’ve been looking at in Red River Gorge is an example of a ridge.
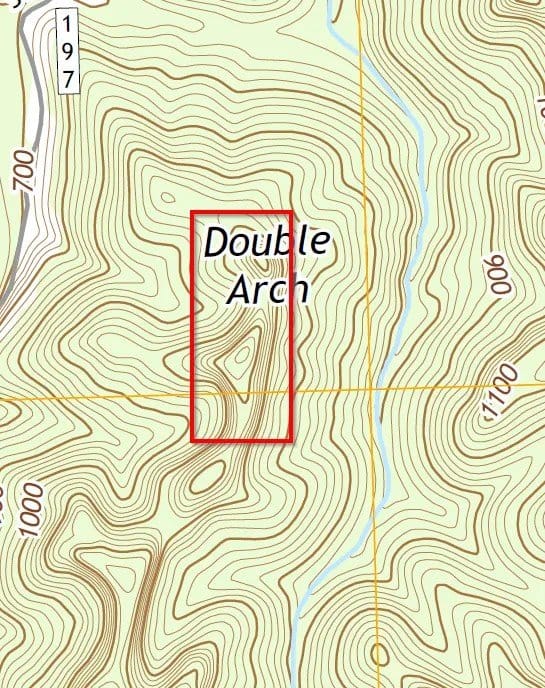
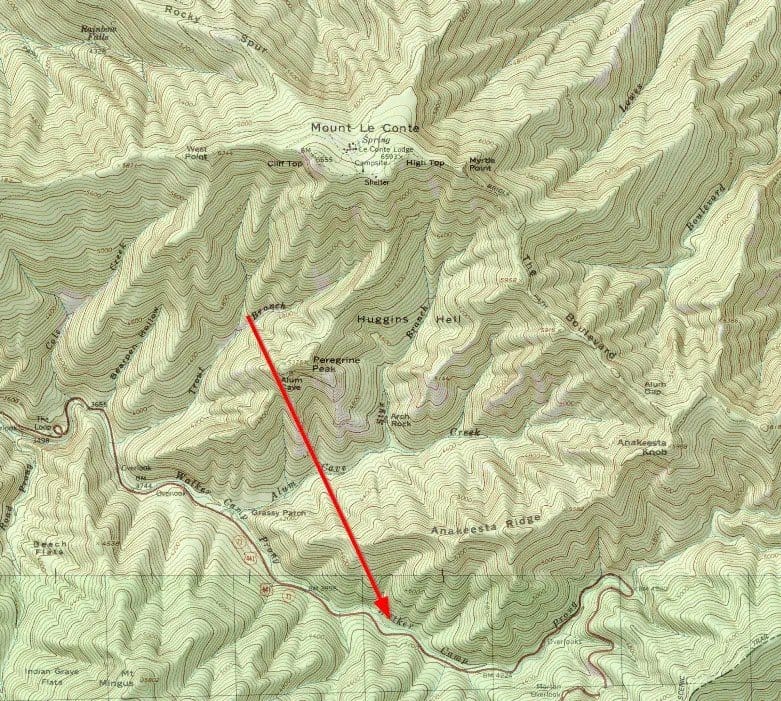
Another example of ridges might be Mt. Leconte in the Great Smoky Mountains, Tennessee. Here we can see many examples of ridges.
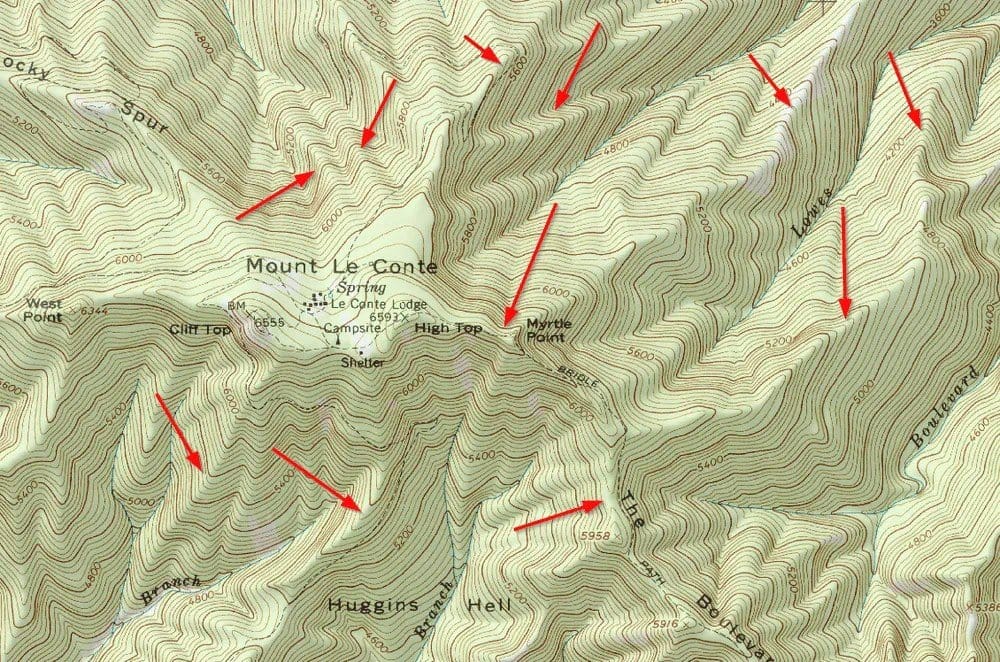
A map of the Mt. LeConte region of the Smokies gives us many examples of ridges. Note that I have only pointed out a few examples in this image. There are a lot more that I didn’t indicate!
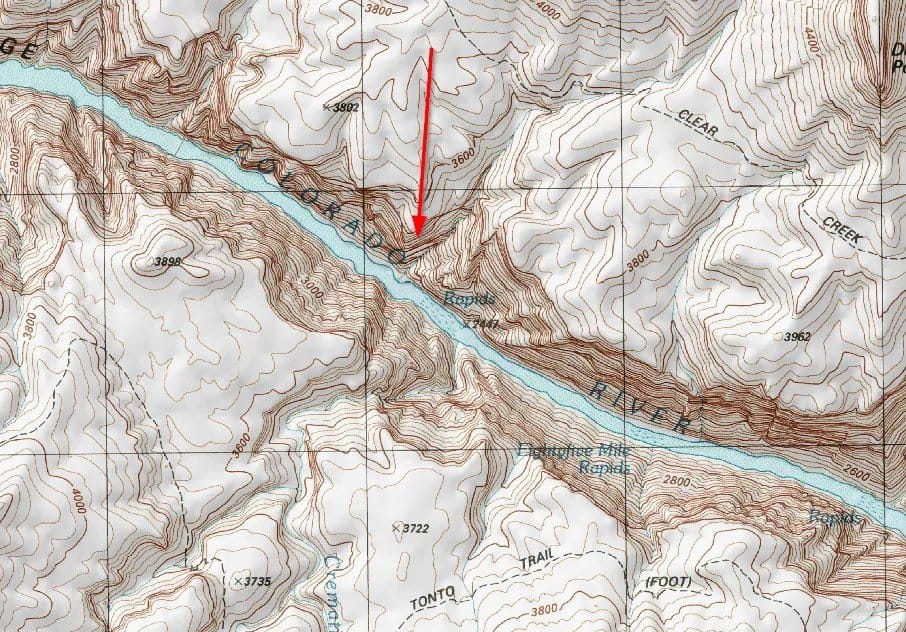
Valleys, Ravines, Canyons, Gullies, Drainages, and Couloirs
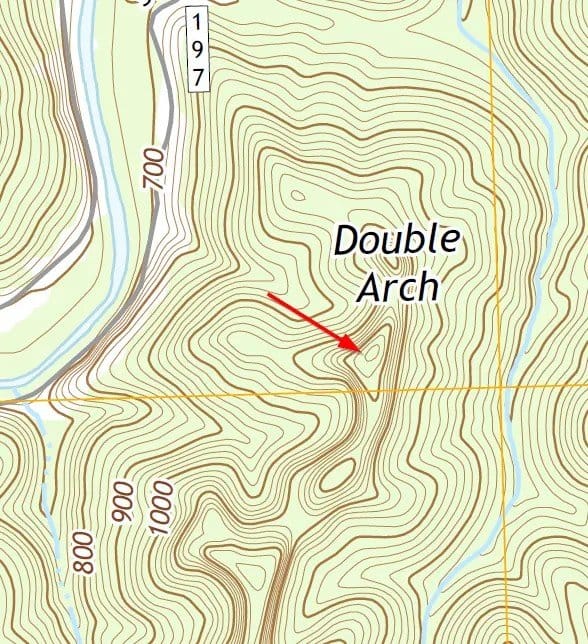
These geological features all appear very similar to ridges. They are again indicated by contour lines that form a V or a U. Unlike ridges, however, valleys, ravines, canyons, gullies, drainages, and couloirs are indicated by downward-facing Vs and Us.
Let’s look at an example of a drainage found on the Double Arch ridge in Red River Gorge.
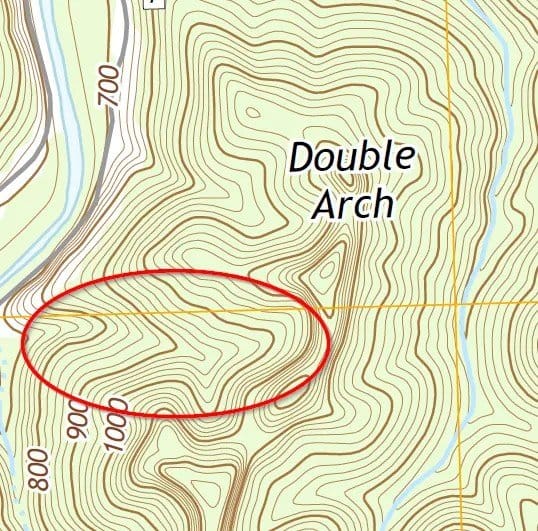
For an example of a couloir, let’s again return to looking around Mt. Denali in Alaska.
For one more extreme example, let’s take a look at a portion of the Grand Canyon, Arizona.
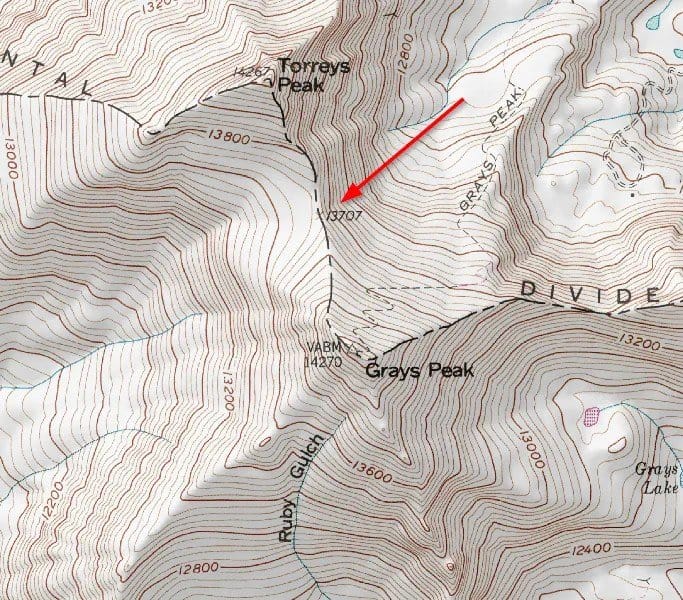
Saddles, Passes, and Cols
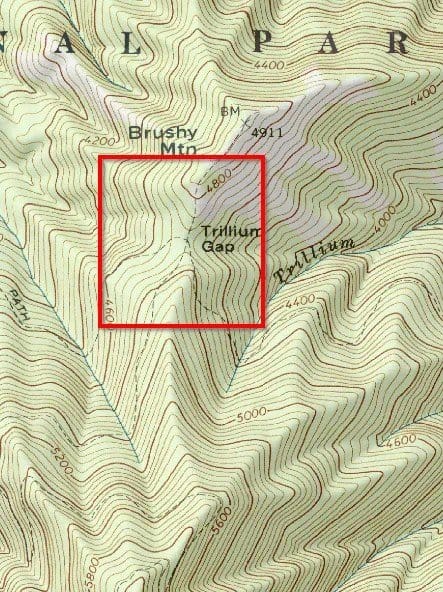
When we’re looking at navigating in the mountains, we will very likely want to be able to identify mountain passes, saddles, and cols. The contour lines in these areas resemble an hourglass shape. Let’s look at an example from the Great Smoky Mountains area.
Another good example is the col between Torreys Peak and Grays Peak in the Front Range of the Rocky Mountains.
Cirques and Bowls
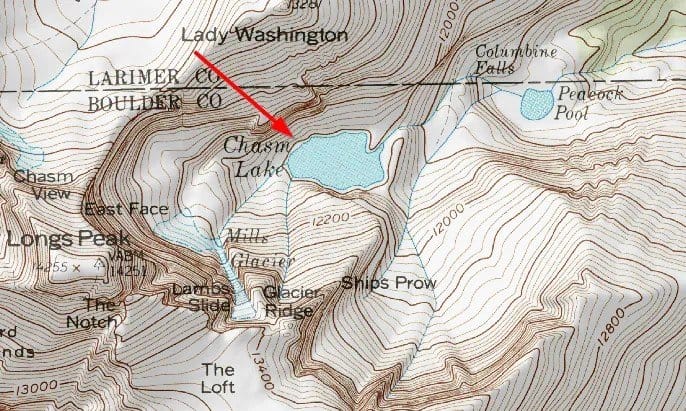
The last geological features we’ll examine here are cirques and bowls. These look very similar to peaks; that is, they are formed by concentric contour lines. The difference is that the contour lines for a cirque or bowl rise from a low spot.
For example, let’s examine a cirque near Longs Peak in the Front Range of the Rocky Mountains.
Wrap up
Wow, this guide sure did end up being long! If you’ve made it this far, you can certainly pat yourself on the back!
In this guide, we’ve examined the basics of reading a topo map. We now have a basic understanding of how cartographers divide up the Earth, how the USGS maps are structured, and how to read and interpret contour lines on a topographic map.
The skills covered here are the absolute most fundamental concepts required for backcountry travel. This skill is essential for safely and effectively planning a wilderness trip.
The best way to further your understanding of these topics is to get out and practice! Take some time to scour topo maps of areas you’re familiar with and start identifying the geological features. Then, start learning to visualize the terrain from the map.
The next time you’re out on a hike, compare the landscape you’re hiking in with your map. Learn to identify what you see in the real world on your map. This is by far the best way to learn!
I’d also like to mention that, in this series, I have focused on using the maps provided by the USGS. I have done this simply because these maps are common and can be freely downloaded. There are many other map sources besides the USGS (I like the maps from the U.S. Forest Service, for example). The good news is that these basic concepts will still apply to any topographic map!
I truly hope that you found this guide helpful! If you did, I would love for you to share it! If you have any questions or comments, please feel free to share them in the comments section below.


Comments ()